Trade Execution Monitoring & Reconciliation
An operational layer that connects strategy decisions, submitted transactions, venue orders and final balances into one auditable timeline.
From $1,500 · final quote before payment
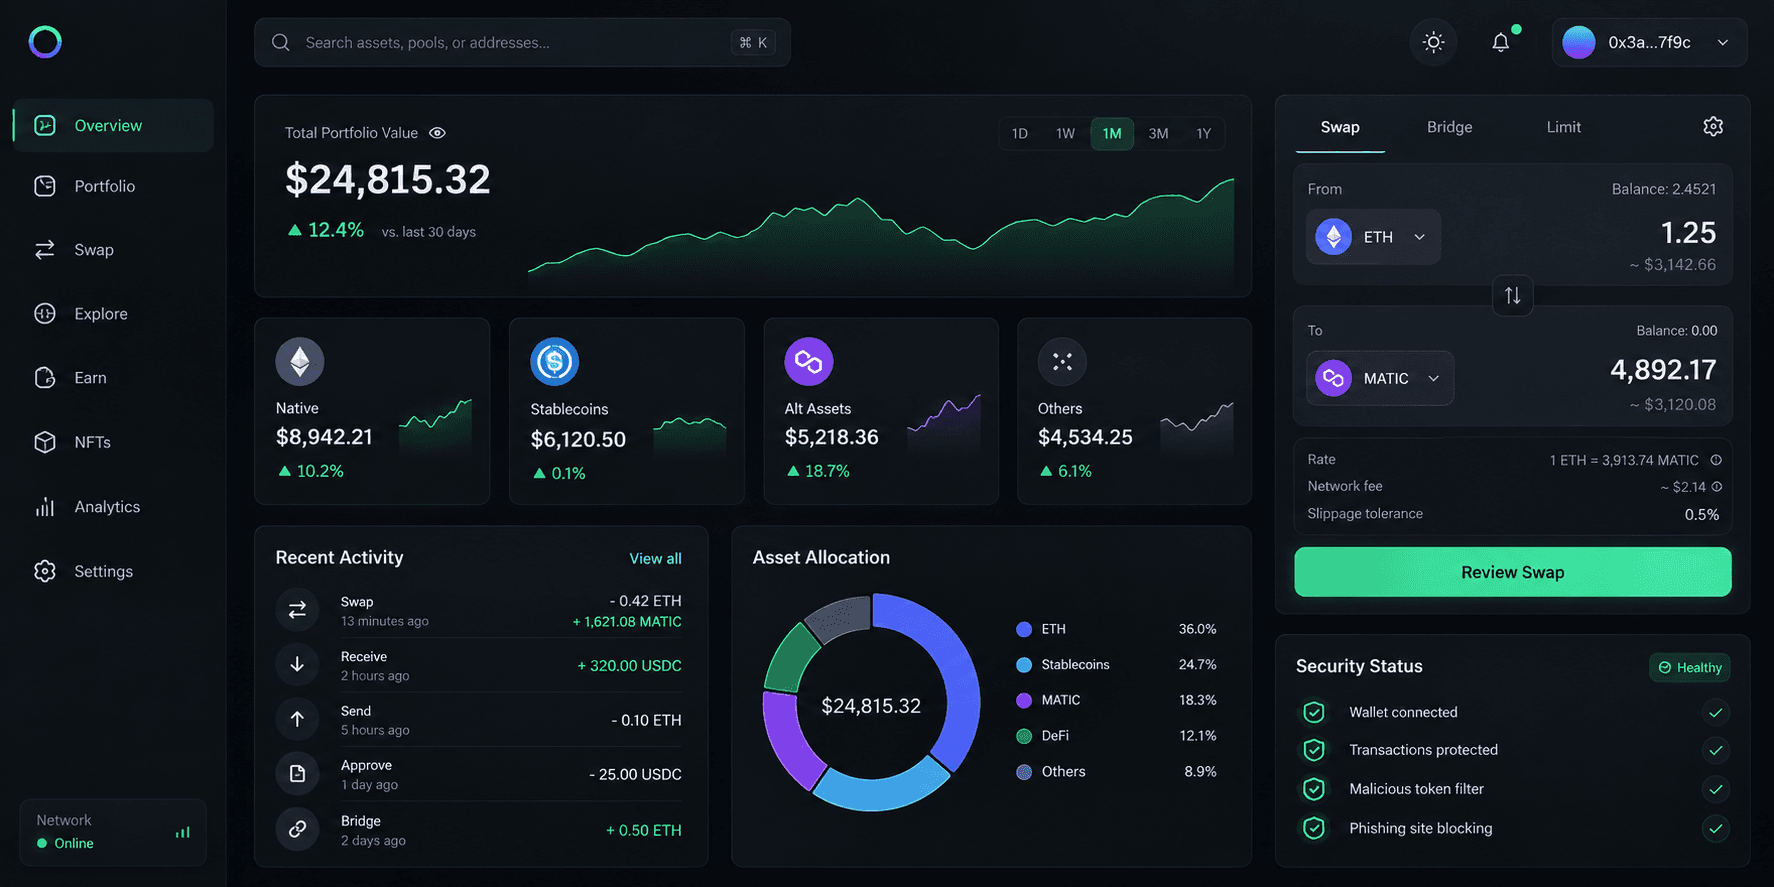
What's included
- Execution-state dashboard
- Transaction and order reconciliation
- Fees and realized P&L records
- Failure classification and alerts
- Exports, logs and deployment
Best fit for
- Trading desks
- Automated execution systems
- Teams debugging missing or duplicate orders
Know what happened to every action
The system records when an opportunity was observed, what the software decided, what it submitted and the final venue or on-chain result. This makes dropped transactions, partial fills, stale quotes and accounting differences visible without relying on a single aggregate P&L number.
Monitoring reports observed execution; it does not make investment decisions or represent a promise of performance.
Delivery and operational boundaries
TierZero provides software engineering, testing, documentation and deployment support. The client controls its infrastructure, accounts, credentials, wallets and product decisions. We do not custody client or end-user assets, transmit funds on a client's behalf, operate customer trading accounts, recommend specific investments or guarantee financial results. Production use remains subject to the client's legal, compliance and risk review.
Technical scope
What we design and verify
A production trade execution monitoring & reconciliation is more than a working demo. Each major component below is scoped around the target network or platform, expected load, failure conditions and the way your team will operate it after handover.
Execution-state dashboard
Submission and execution logic includes simulation, configurable limits, explicit failure states and structured logs. Production credentials and signing authority remain separated from application logic.
Transaction and order reconciliation
Submission and execution logic includes simulation, configurable limits, explicit failure states and structured logs. Production credentials and signing authority remain separated from application logic.
Fees and realized P&L records
This part of Trade Execution Monitoring & Reconciliation is specified as a separate, testable component with acceptance criteria, logging and documented configuration rather than hidden hard-coded behavior.
Failure classification and alerts
Operational visibility is part of the delivered system: health, important actions, failures and relevant business metrics are exposed without placing private keys in the interface.
Exports, logs and deployment
Delivery includes repeatable setup instructions and a handover path for client-owned infrastructure, so operation does not depend on permanent access by TierZero.
Definition of done
Before delivery, we validate the agreed happy path, expected failures and operational controls. You receive the applicable source code, configuration reference, deployment instructions and a walkthrough of the system. Any third-party fees, infrastructure subscriptions or external dependencies are identified during scoping.
Delivery
How the engagement works
Technical discovery
We confirm the objective, constraints, integrations and acceptance criteria.
Architecture & scope
You receive milestones, responsibilities, timeline and the final quote.
Build & verification
Implementation is tested against the agreed scenarios with visible progress.
Handover & support
We deploy or hand over the code, documentation and operating instructions.
Built for production
Scope, security and ownership
Delivery model
Application, data and infrastructure components are scoped as independently testable services with clear interfaces.
Security baseline
Secrets, authentication, observability, backups and deployment access are handled with least-privilege defaults.
What we need from you
User flows, integrations, traffic expectations, hosting constraints and existing code or infrastructure.
Questions before you start
What is included in the Trade Execution Monitoring & Reconciliation starting price?+
The $1,500 figure is a starting point. We confirm the exact scope, integrations, acceptance criteria and fixed quote before work begins. The listed deliverables are included unless the agreed proposal says otherwise.
How long does delivery take?+
Timing depends on integrations, testing depth and whether existing code is involved. After a short technical discovery, we provide milestones and a delivery estimate before payment.
Who controls the source code, infrastructure and keys?+
The agreed source code and deployment are handed over to the client. Production wallets, seed phrases and private keys remain client-controlled; we design integrations around scoped credentials and least-privilege access.
Do you guarantee trading profits or a specific return?+
No. We build software and execution infrastructure, not guaranteed-return products. Results depend on strategy, competition, liquidity, fees and market conditions. Testing, simulation and explicit risk controls should precede live capital.
Can you work with our existing code or infrastructure?+
Yes. We can begin with a focused review, identify reusable components and propose the smallest safe implementation path instead of forcing a full rebuild.
Technical resources
Related guides
Skipping Preflight Simulation on Solana: Speed vs Safety Tradeoffs
Disabling preflight checks removes one RPC round-trip and can shave 20–80 ms off your submission latency, but exposes your bot to fee-account errors and stale blockhash reverts — we quantify the failure rates and show when the tradeoff pays off.
Read guide InfrastructureHiring a Solana Infrastructure Engineer: What to Actually Look For
Most candidates can configure an RPC node but few understand shred propagation, geyser plugin internals, or NUMA-aware thread pinning — we outline the interview signals, take-home task design, and market-rate ranges for trading-focused infra engineers in 2025.
Read guide InfrastructureBest Monitoring Stack for a Solana Trading Bot: Grafana + Prometheus
We cover which metrics matter — slot lag, confirmation latency, slot leader proximity, dropped transactions — and provide a ready-made Grafana dashboard JSON and Prometheus scrape config tuned for production Solana HFT bots.
Read guideRelated services
Get a practical scope, not a sales pitch
Tell us the target network or platform, required integrations, expected load and what you already have. We'll reply with the next technical questions, delivery plan and quote.